Understanding the Linux Kernel, Visually
Extended Abstract (Webpage Version)
Hanzhi Liu, Yanyan Jiang, Chang Xu
Proceedings of the 20th European Conference on Computer Systems (Eurosys’25).
[doi]
[pdf]
[tool]
| English | 简体中文 | [Back to Mainpage] |
Abstract
Understanding the Linux kernel is challenging due to its large and complex program state. While existing kernel debugging tools provide full access to kernel states at arbitrary levels of detail, developers often spend a significant amount of time sifting through redundant information to find what is truly useful. Additionally, the textual results provided by traditional debuggers are often insufficient for expressing high-dimensional information in a readable manner.
This paper presents Visualinux, the first debugging framework that can simplify the program state of the Linux kernel to a level that can be visually understood with low programming complexity and effort. Visualinux includes a domain-specific language for specifying simplifications of a kernel object graph, an SQL-like domain-specific language for customizing the simplified object graph, and a panel-based interactive debugger. Evaluation results show that Visualinux can visualize various complex kernel components and efficiently assist developers in diagnosing sophisticated kernel bugs.
Motivation
For years, developers have used GDB and log/trace tools to debug the Linux kernel. These tools provide mechanisms to examine kernel states at various levels of detail. However, considering that the human brain can only handle a limited amount of information at a time, developers are often overwhelmed by the abundance of information. Unfortunately, existing tools require significant human or programming effort to extract a specific subset of the information for a particular debugging objective.
As a typical example, the maple tree introduced in the Linux kernel 6.1 is a scalable data structure for maintaining a set of ordered intervals, which replaces the two-decade-old red-black tree-based implementation of memory-mapped regions. We struggled to understand this new data structure: a textual interface naturally falls short of displaying high-dimensional information (e.g., an interconnected, complex data structure) in a readable way. We wrote scripts to unwrap the \verb|union| type of nodes and parse the compressed pointers. Nevertheless, comprehending the list of tree nodes with indirect pointers remained mentally challenging.
The obstacle to understand the maple tree is rooted in the complexity of the Linux kernel: there are millions of live objects at runtime, with complex relations among them. Simply “printing” these objects as text produces an overwhelming amount of information for debugging purposes. Such complexity leads to the following question:
- What kind of mechanism can help developers effectively and efficiently customize a view of the kernel object graph for the purpose of understanding kernel states?
Existing kernel debugging techniques either do not focus on program state understanding or lack appropriate abstractions for high-level data structures. Moreover, most of existing tools are textual and are unable to produce readable results for high-dimensional information.
Past research has confirmed that program visualization can effectively help developers understand program states. However, none of traditional visualized debuggers can handle the excessively large and complex program state of the Linux kernel. The lack of suitable abstractions in existing tools forces developers to work with complete diagrams of entire massive objects and handle long and deep pointer chains.
Approach
We respond to the above question by observing that the kernel state is essentially a graph, where kernel objects are pointer-connected nodes. A human debuggers’ (implicit) goal is to simplify this graph to meet their debugging objectives. This paper argues that such simplified views can be created through two layers of simplification:
- ViewCL, the View Construction Language, which allows for the creation of object graphs (plots) at customizable levels of abstraction. ViewCL employs three fundamental operators, prune, flatten and distill, to programmatically reduce the kernel states.
- ViewQL, the View Query Language, which enables customization of a simplified object graph in a developer-friendly manner. ViewQL provides the ability to exclude specific irrelevant object types or fields, eventually producing a human-readable plot.
Our approach is designed upon Daniel Jackson’s small scope hypothesis, which suggests that a small portion (sufficiently small to be visually processed by the human brain) of the state suffices for understanding and debugging a specific part of the system. Our two domain-specific languages work together to break down the large, complex kernel state into simpler state views that are visually tractable. With commonly used Linux kernel data structures and containers being predefined in ViewCL, most developers can work exclusively with ViewQL, often without even being aware of ViewCL’s existence. The simplicity of ViewQL also enables large language models to customize plots based on user’s textual descriptions, without requiring knowledge of either ViewCL or ViewQL.
Based on the approach we propose Visualinux, the first debugging framework that enables developers to programmatically simplify the program state of the Linux kernel to a level that can be visually understood. This is beyond the capability of existing debugging abstractions. Visualinux also offers developers a user-friendly, push-button interface to manage multiple plots and customize their displayed views, as the following figure illustrates.
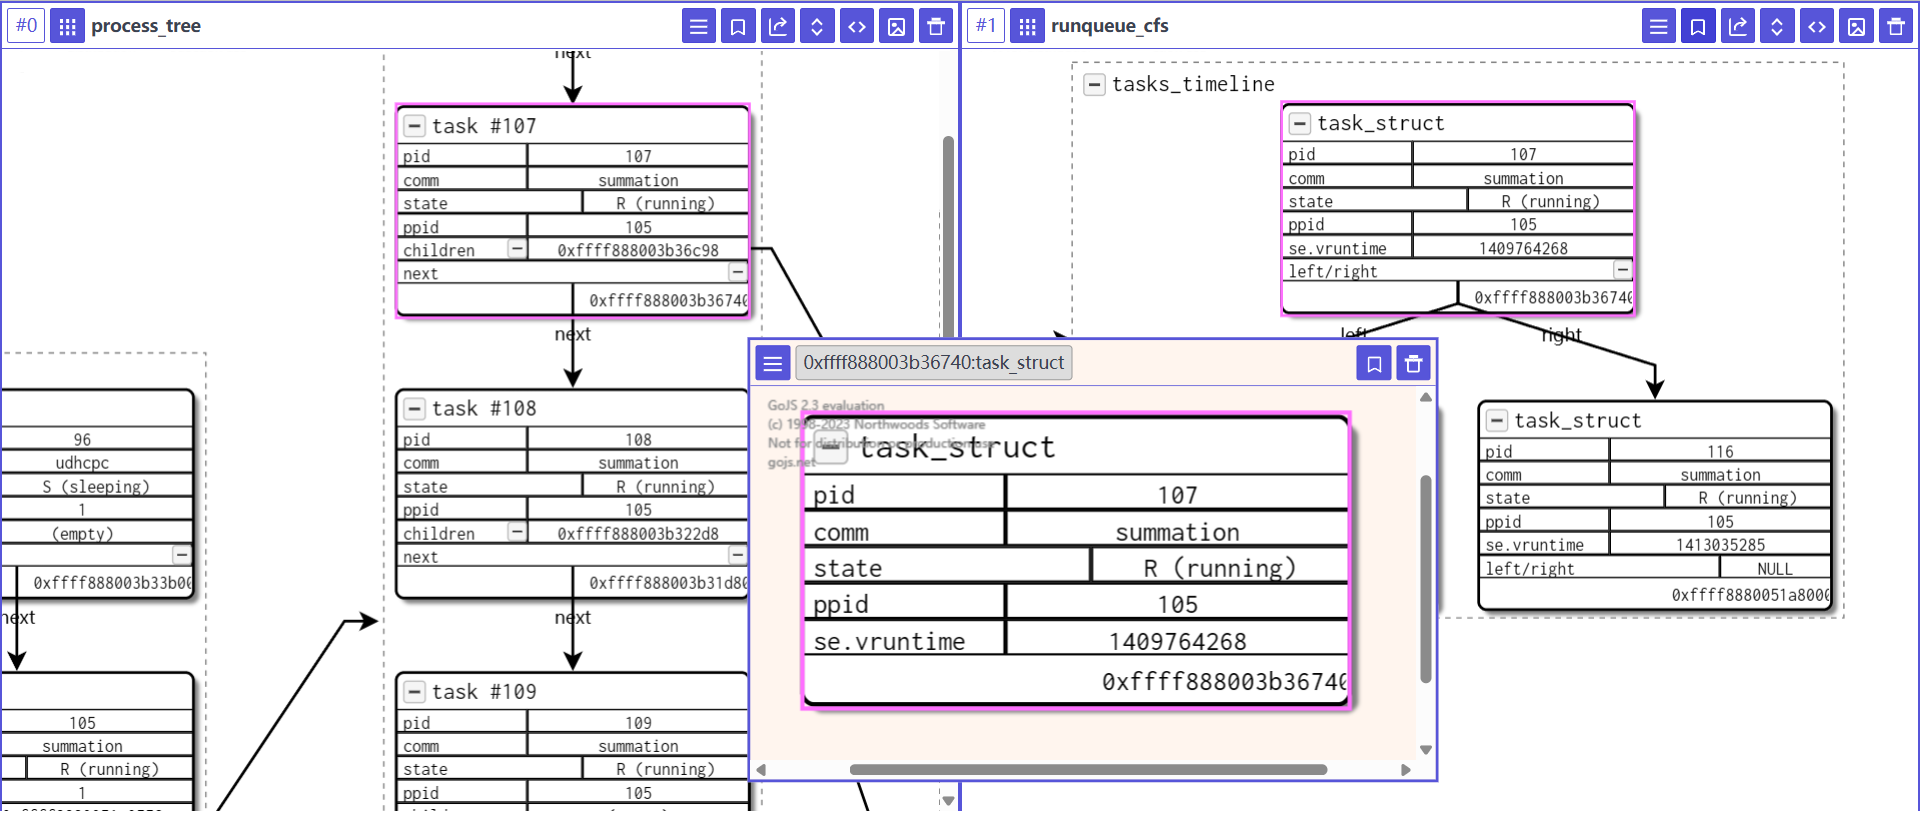
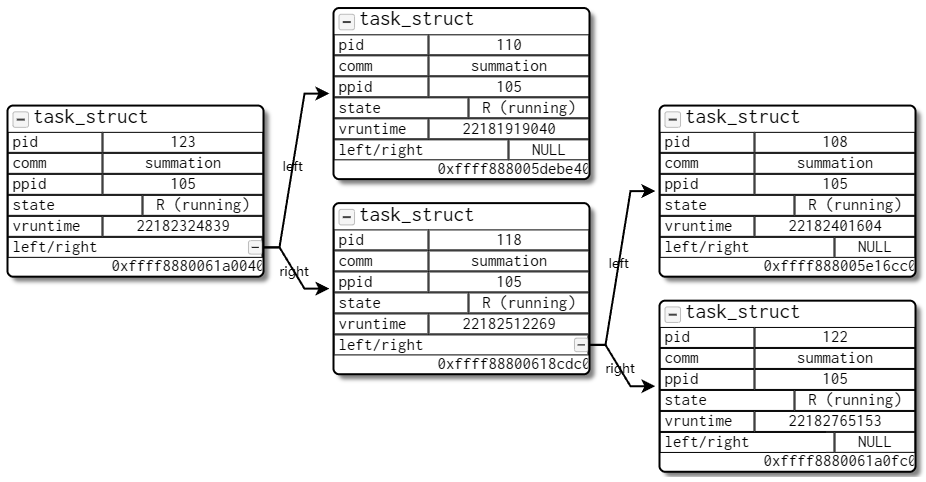
Visualinux is capable of visualizing data structures at various levels of customizations. For instance, only a few lines of ViewCL code can yield a plot of the CFS Scheduler Run Queue, which is visualized as a binary search tree managing the Completely Fair Scheduler (CFS) run queue:
// Declare a Box for a task_struct object
define Task as Box<task_struct> [
    Text pid, comm
    Text ppid: parent.pid
    Text<string> state: ${task_state(@this)}
                     // ${...} evaluates a C expression
                     // @this refers to the Box itself
    Text se.vruntime
]
// cpu_rq(0) is the run queue of the first processor
root = ${cpu_rq(0)->cfs.tasks_timeline}
// RBTree is our predefined container data structure
// @root refers to the definition in Line 11
sched_tree = RBTree(@root).forEach |node| {
    // For each node yield (create) a box of Task whose
    // associated object is @node.se.run_node
    yield Task<task_struct.se.run_node>(@node)
}
// Plot the object graph rooted at @sched_tree
plot @sched_tree
Implementation
We implement Visualinux prototype for interactive kernel debugging. It comprises two main components: the GDB extension, which is integrated into the GDB host to support ViewCL, and a visualizer front-end that supports ViewQL. The tool is publicly available at:
Evaluation
To evaluate the ability of Visualinux, we evolve some representative figures of the well-known (though now obsolete) textbook, Understanding the Linux Kernel, to the latest Linux 6. Results show that Visualinux can handle various data structures and mechanisms in the Linux kernel. We also observe that a significant proportion of core kernel mechanism implementations have changed significantly since Linux 2.6.11. All generated plots are available in the public site, including the maple tree mentioned in Motivation.
Visualinux can also assist in diagnosing real-world kernel bugs that require an understanding of the kernel state. We demonstrate its effectiveness through case studies involving the diagnosis of real-world kernel vulnerabilities (CVE-2023-3269 and CVE-2022-0847).
Finally, we evaluate Visualinux in two representative debugging scenarios and the results show that the performance overhead of Visualinux is generally acceptable.